Compare greenfield and brownfield infrastructure yields
The clean version says greenfield infrastructure pays more because it is riskier, while brownfield pays less because it is already built. True. Also too neat.
In broad terms, greenfield infrastructure often targets IRRs in the 10%–15%+ range. Brownfield assets more commonly sit in the 5%–9% yield zone, with steadier cash flows and fewer ways to blow up before revenue starts. That is the headline. The work is figuring out whether the extra greenfield return is actual compensation or just a higher number typed into a deck.
The risk-return spectrum: the yield gap is not free money
Greenfield and brownfield are not merely “new” versus “old.” They sit in different parts of the infrastructure risk stack.
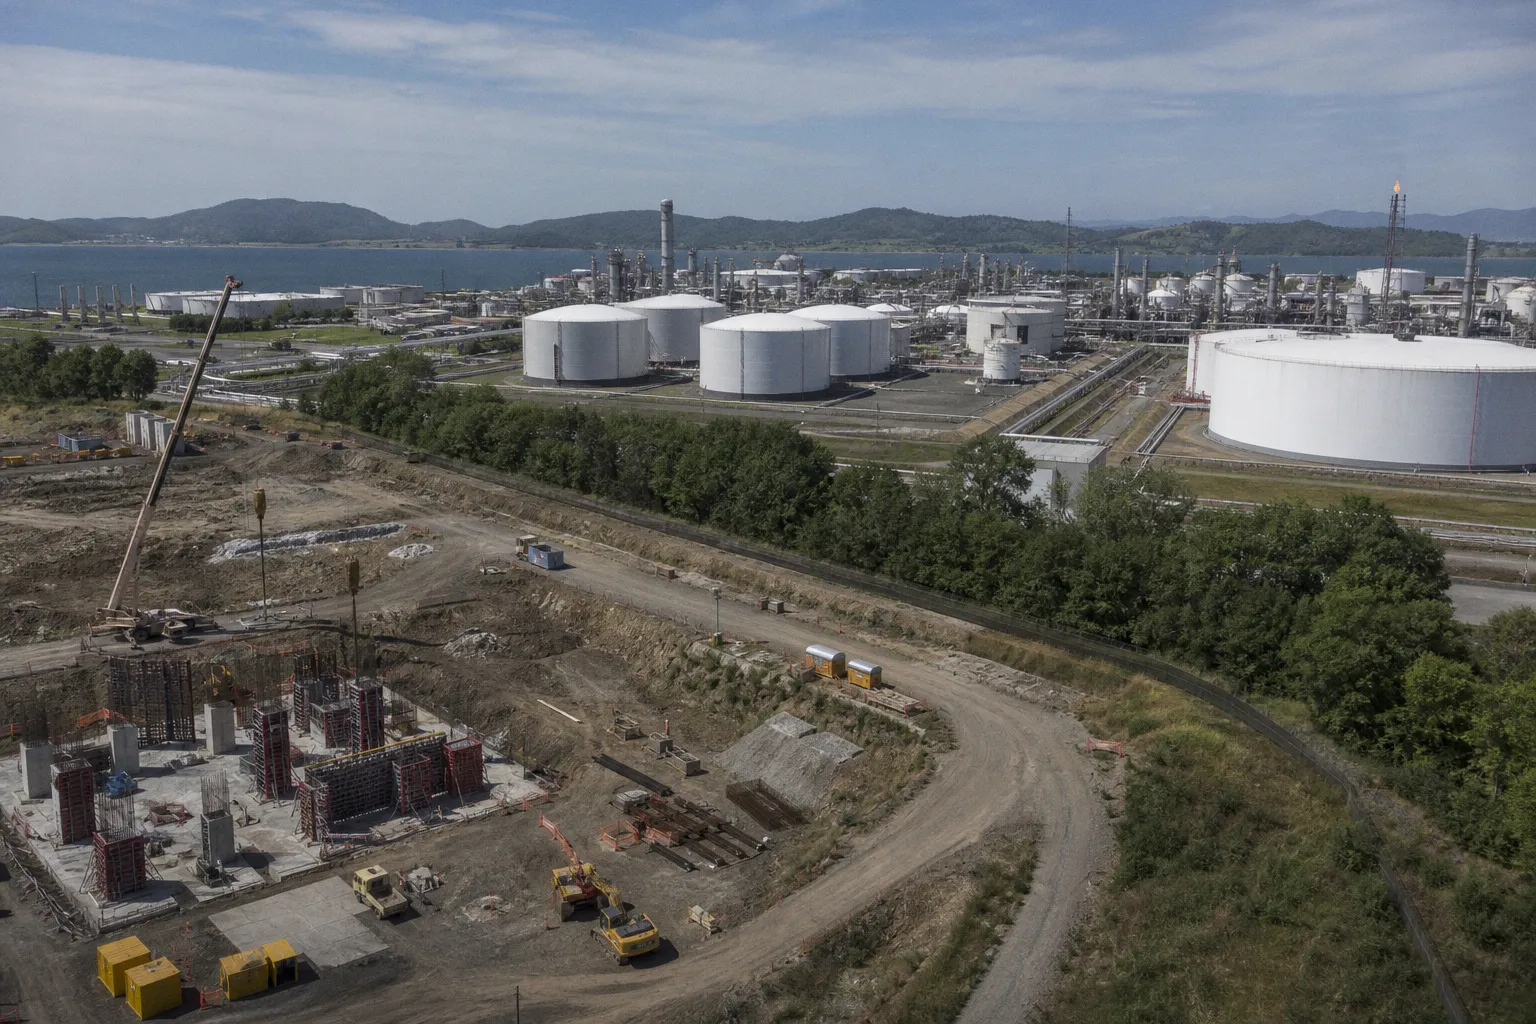
Greenfield is pre-operational or in development. Think renewable energy projects before commercial operations, toll roads before traffic history, fiber networks before take-up rates are proven, ports before throughput is visible. The sponsor is selling a future asset.
Brownfield is already operational. It has revenue history. It has maintenance records. It has customers, contracts, regulatory treatment, and usually enough operating data to make the spreadsheet less fictional. Not perfect. Just less theatrical.
That difference explains the yield gap.
| Parameter | Greenfield infrastructure | Brownfield infrastructure |
|---|---|---|
| Operating status | Development / pre-operational | Operational |
| Typical target return | 10%–15%+ IRR | 5%–9% yield / return range |
| Main return driver | Development premium, construction execution, asset ramp-up | Contracted or regulated cash flow, operational maturity |
| Core risk | Completion risk | Residual regulatory, political, demand, and operating risk |
| Cash flow profile | Back-ended, uncertain before COD | Current income, more predictable |
| LP use case | Growth, inflation exposure with upside, portfolio return enhancement | Core infrastructure, income, liability matching |
| Model fragility | High: costs, delays, permits, demand assumptions | Lower: still sensitive to regulation and capex |
The lazy allocator looks at that table and says: “Greenfield gives me 400 to 600 basis points more.” The better allocator asks: “How much of that spread survives after delay, cost inflation, curtailment, litigation, leverage costs, and management fees?”
That is the only serious way to check and compare greenfield and brownfield infrastructure yields. Not by staring at headline IRR. By pulling apart the mechanism that supposedly creates it.
A higher greenfield IRR is not alpha. It is usually the market charging rent for uncertainty.
Quantifying greenfield IRR: what the 10%–15%+ target is really pricing
Greenfield return targets are designed to look muscular. They need to. Nobody raises capital for a construction-stage asset by promising core-like returns with development-stage headaches.
The target IRR in the 10%–15%+ range usually reflects four risk buckets.
1. Construction risk
This is the obvious one, and somehow still the one most often underpriced during capital-raising.
Construction risk means the asset may cost more, take longer, or fail to meet specs. In infrastructure, the problem is rarely one clean disaster. It is the grind:
- materials cost inflation;
- labor availability;
- interconnection delays in power projects;
- geotechnical surprises;
- contractor failure;
- change orders;
- supply-chain slippage;
- weather disruption;
- disputes over scope and liability.
A six-month delay can turn an attractive model into a mediocre one. A twelve-month delay can hit IRR harder than many LPs expect because greenfield math is timing-sensitive. Capital goes out early. Cash comes in late. The clock is not neutral.
This is where the sponsor’s EPC contract matters. Fixed-price, date-certain language is useful. Parent guarantees are useful. Liquidated damages are useful. None of them are magic. Counterparty credit still matters. Legal enforceability still matters. And if the contractor’s margin is already razor-thin, “risk transfer” may be less a shield than a future lawsuit.
2. Permitting and regulatory risk
Greenfield assets do not just need capital. They need permission.
Permits can stretch. Grid connections can move. Environmental approvals can be challenged. Local politics can flip. Public-private partnership terms can become campaign material. The project can be economically sound and still bleed time in a regulatory queue.
That matters because greenfield infrastructure is often sold as long-duration, inflation-linked, socially useful capital. Fine. But the bridge between social usefulness and distributable cash is regulatory execution. Miss that bridge and the model starts swimming.
The more complex the stakeholder map, the higher the return premium should be. A contracted solar project on a known site with interconnection visibility is not the same animal as a new urban transport concession with ridership risk, construction disruption, tariff politics, and city-level approval layers.
3. Demand and ramp-up uncertainty
A completed asset is not automatically a performing asset.
For transport, demand risk can be traffic, passengers, cargo volume, or logistics flows. For digital infrastructure, it can be tenancy, utilization, churn, or competition. For renewable assets, it can be merchant exposure, curtailment, resource variability, and offtaker strength.
Greenfield models often assume ramp-up curves that look smooth because jagged charts scare investment committees. Reality prefers jagged.
This is why contracted revenue matters. Availability-based PPPs, regulated asset base models, long-term take-or-pay agreements, and credible power purchase agreements can compress risk. Merchant exposure does the opposite. It may increase upside, but it also turns an infrastructure asset into something closer to a commodity-linked trade with concrete attached.
4. Financing and refinancing risk
Many greenfield deals rely on staged leverage or refinancing after completion. That can work. It can also become a trap if rates move, credit spreads widen, or lenders decide the sector has had enough fun.
Development equity may expect to de-risk at commercial operation date. The model assumes cheaper debt arrives after completion. But if the refinancing market is shut, the cap table gets stuck with expensive capital. Return compression follows. Nobody puts that in the teaser headline.
This is where private equity-style infrastructure can behave less like “stable real assets” and more like any other levered strategy. Entry basis, debt terms, covenant headroom, and exit liquidity matter. The asset may be tangible. The return is still financial engineering plus execution.
Brownfield stability: why 5%–9% can be rational, not boring
Brownfield infrastructure gets mocked in bull markets because the returns look dull. Then markets break, distributions matter again, and suddenly boring becomes a feature.
Operational assets typically offer lower, more stable yields because the unknowns are narrower. The facility exists. Customers exist. Contracts may exist. Maintenance capex can be estimated from records, not vibes. Revenue history gives investors something to underwrite beyond sponsor optimism.
Institutional investors like brownfield assets for core infrastructure exposure because they can provide:
- current cash yield;
- lower volatility than development-stage projects;
- inflation-linked or regulated revenues in some structures;
- longer-duration cash flows;
- portfolio ballast when growth assets are repricing.
This is where pension funds, insurers, and core infrastructure funds tend to feel more comfortable. They are not looking for venture-style power laws. They are looking for resilient income that does not require a miracle at year five.
But “brownfield” is not code for safe. That is another marketing misdemeanor.
A mature toll road can face traffic erosion. A regulated utility can get clipped by a hostile regulator. An airport can take demand shocks. A port can lose volume from trade shifts. A district heating asset can discover deferred maintenance was not fully captured in the vendor data room. Operational history reduces uncertainty. It does not abolish it.
Brownfield risk is quieter. That does not make it smaller. It just makes it easier to miss until the regulator, tenant, or maintenance engineer ruins the quarter.
The brownfield diligence questions that actually move yield
The useful questions are not “Is the asset operational?” That is a label. The real questions are sharper.
1. How contracted is the revenue?
A ten-year contracted cash flow with investment-grade counterparties deserves a different discount rate than usage-based revenue exposed to volume swings.
2. How inflation-linked is the tariff or contract?
Inflation linkage is valuable only if it is enforceable, timely, and not politically toxic. A theoretical CPI pass-through that triggers public outrage is not clean protection.
3. What is the maintenance capex reality?
EBITDA is a toy if sustaining capex is understated. Mature assets can distribute cash while quietly accumulating asset-quality debt.
4. Where are we in the regulatory cycle?
Buying right before a tariff reset is not the same as buying after one. The same asset can carry a different yield profile depending on regulatory timing.
5. Is leverage doing too much of the work?
If the brownfield yield only looks attractive because debt was layered aggressively, the asset is not stable. It is just wearing a lower-volatility costume.
6. Who is the natural buyer at exit?
Core-plus funds, pension platforms, sovereign capital, listed infrastructure vehicles, strategic operators — exit depth affects realized return. Illiquidity is not a rounding error.
For LPs comparing funds, these questions matter more than whether the GP uses the word “defensive” 19 times in the annual meeting deck.
How to check compare greenfield and brownfield infrastructure yields without getting played
The phrase is clumsy, but the task is real: how to check compare greenfield and brownfield infrastructure yields in a way that does not reward the best storyteller.
Start with the base case, then attack it. Infrastructure models can look precise because they run for decades. That precision is often decorative. The longer the model, the more room for elegant nonsense.
A pragmatic comparison needs five lenses.
1. Compare return type, not just return level
A 12% greenfield IRR and a 7% brownfield yield are not comparable numbers unless you know what they are made of.
Greenfield IRR may include:
- development margin;
- asset re-rating after completion;
- leverage introduced post-COD;
- terminal value assumptions;
- tax credits or subsidies;
- merchant upside;
- aggressive ramp-up assumptions.
Brownfield yield may include:
- current cash distribution;
- regulated return;
- contracted revenue;
- modest volume growth;
- refinancing gains;
- operational efficiency savings.
One is often back-ended and valuation-sensitive. The other is more income-weighted. Same asset class. Different cash flow physics.
2. Normalize for leverage
Greenfield and brownfield deals can have very different leverage profiles. Comparing equity returns without normalizing debt is how LPs end up admiring risk they did not know they bought.
Ask what the unlevered return looks like. Then look at:
- debt maturity;
- floating-rate exposure;
- interest-rate hedging;
- debt service coverage;
- refinancing assumptions;
- covenant cushion;
- construction debt terms versus permanent debt terms.
If the greenfield premium disappears on an unlevered basis, the deal is not an infrastructure development premium. It is a rates and leverage bet.
3. Stress the timeline
For greenfield, timeline stress is brutal and necessary. Push completion out by six months, twelve months, eighteen months. Add cost overruns. Delay revenue start. Then look at IRR decay.
For brownfield, stress concession renewal, tariff reset timing, maintenance outages, customer loss, and demand shocks. Mature assets can have cliff risks too. They are just usually buried deeper in the legal documents.
4. Separate contracted yield from assumed exit value
Greenfield deals often depend on selling a de-risked asset to a lower-cost-of-capital buyer after completion. That arbitrage can be real. Build, de-risk, sell to core capital. Classic play.
But the exit multiple is not a law of nature. If rates rise or core infrastructure capital pulls back, the buyer’s bid changes. The development spread gets squeezed.
Brownfield assets also depend on exit assumptions, but current income usually does more of the heavy lifting. That distinction matters for LP liquidity planning. A paper IRR with no distributions is not the same as cash yield.
5. Identify who is getting paid before the LP
Infrastructure fee stacks can be ugly. Development fees, transaction fees, asset management fees, financing fees, promote structures, operating platform costs. The gross-to-net spread matters.
The more complex the development chain, the more toll booths appear before LP capital gets paid. Everyone loves infrastructure because it is long-duration. Conveniently, so are the fees.
For broader market context, it is occasionally useful to look outside the fund deck and track how public narratives around infrastructure, policy, and household cost pressures show up in general news and civic coverage such as Nevla News. Infrastructure is never only a spreadsheet. Voters and regulators also get a vote.
Completion risk premium: the greenfield spread’s main engine
Completion risk is the central reason greenfield infrastructure targets higher returns. It covers the period when capital is committed but the asset is not yet producing stable cash flow.
That period is where return dispersion lives.
A good greenfield manager does not eliminate completion risk. They price it, allocate it, contract around it, and keep enough contingency to survive reality. A weak manager assumes away the hard parts and calls the remaining spread “proprietary sourcing.”
The completion risk premium should be higher when:
- permits are unresolved or vulnerable to challenge;
- engineering complexity is high;
- supply chains are tight;
- revenue depends on unproven demand;
- the project has multiple public stakeholders;
- the contractor package is weak;
- the jurisdiction has unstable policy treatment;
- inflation pass-through is delayed or capped;
- grid, transport, or connection dependencies sit outside sponsor control.
It should be lower when:
- permits are substantially secured;
- technology is proven;
- EPC terms are strong;
- counterparties are creditworthy;
- revenues are contracted;
- construction timeline is short;
- contingency is credible;
- comparable assets have been delivered in the same market.
That last point matters. Infrastructure investors love to claim uniqueness. Sometimes uniqueness is just another word for no comps.
Sector matters: not all greenfield is equally greenfield
A battery storage project, a data center campus, a wind farm, a desalination plant, and a toll road do not carry the same risk package. The “greenfield premium” is sector-specific.
Renewables may have proven technology but face interconnection, curtailment, merchant price, and subsidy risk. Transport projects may face land acquisition, environmental approvals, and demand forecasting errors. Digital infrastructure may look like real assets but can carry technology obsolescence and customer concentration risk. Social infrastructure may be availability-based and lower-risk, but political and procurement issues still matter.
So when a manager says “greenfield infrastructure targets 12%,” the follow-up is simple: 12% for what, where, with whom, under which contracts, and with how much leverage?
If they cannot answer cleanly, the number is decoration.
Strategic allocation: growth versus income, not hero versus coward
The greenfield-versus-brownfield debate is often framed as brave capital versus conservative capital. That is cartoon finance.
The better framing is portfolio function.
Greenfield belongs where the LP can tolerate:
- delayed distributions;
- higher J-curve pressure;
- construction and permitting volatility;
- wider return dispersion;
- less certain exit timing;
- more intensive manager underwriting.
Brownfield belongs where the LP needs:
- current or near-current income;
- lower volatility;
- clearer asset valuation;
- core infrastructure exposure;
- inflation-linked characteristics;
- less dependence on development execution.
A mature institutional portfolio can own both. The mistake is pretending they do the same job.
For a pension plan with liquidity needs, brownfield may be the ballast. For an endowment with a long horizon and high tolerance for illiquidity, selective greenfield may add return. For an insurer matching liabilities, the contracted cash flow profile may matter more than headline IRR. For a family office chasing nominal return, greenfield can look tempting — especially right before it becomes educational.
A clean allocation lens
Use this blunt filter before buying the pitch.
| LP objective | Better fit | Why |
|---|---|---|
| Stable income | Brownfield | Operational cash flows are already visible |
| Higher return target | Greenfield | Development premium can lift IRR if execution holds |
| Lower volatility | Brownfield | Less exposure to construction and ramp-up uncertainty |
| Inflation-linked exposure | Both, structure-dependent | Contract and regulation matter more than label |
| Capital appreciation | Greenfield | De-risking can create value uplift |
| Liability matching | Brownfield | Cash flow timing is usually more predictable |
| Opportunistic real assets sleeve | Greenfield | Risk budget can absorb wider dispersion |
| Core infrastructure allocation | Brownfield | Better aligned with low-volatility institutional use case |
The important phrase is “structure-dependent.” Infrastructure labels are cheap. Contracts are expensive. Read the contracts.
What this actually means for LPs
Greenfield infrastructure can justify 10%–15%+ target IRRs. Brownfield assets can justify 5%–9% return profiles. The yield gap is not a market anomaly. It is the price of moving from operating history to development uncertainty.
But the spread is only attractive if it is properly underwritten. Otherwise, it is just compensation for risks the GP has not admitted yet.
For LPs, the practical takeaway is blunt:
- Do not compare greenfield IRR with brownfield yield as if they are interchangeable.
- Normalize for leverage and fees.
- Stress construction delays and refinancing assumptions.
- Separate contracted cash flow from terminal value fantasy.
- Demand sector-specific evidence, not infrastructure poetry.
- Treat “core-plus” and “value-add infrastructure” labels with suspicion until the risk sits on the table.
Brownfield is not risk-free. Greenfield is not automatically higher-return. The right question is not which bucket pays more. It is whether the extra return per unit of execution risk survives contact with permits, contractors, regulators, lenders, and time.
That is where infrastructure investing gets real. Not in the deck. In the drawdown.